Visualization
Experimental
serq draw works and is covered by make check, but the notation, the
flags and the output are not stable and may change between releases.
What is not done is at the bottom of this page.
Design discussion: RFC #1.
FILE is program text (.sq) or IR (.json), as for the other commands.
Why the figure is generated rather than drawn
The IR is the definition of a serQ program, and the interpreter, the generated Lean model and the oracle tests are already its consumers. A figure is a fourth, and the cheapest of them: it needs no clock, no oracle and no proof.
It is also the one that would otherwise become a hand-kept copy. docs/ir.md
exists because the vLLM request program had three of those. A figure drawn
by hand would be a fourth.
The view is a pure function of ir::Program. No simulation, no clock, no
RNG — the same IR gives the same bytes.
The deployment view
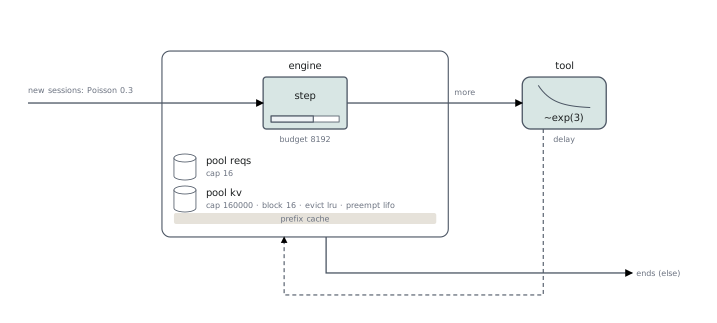
The program as a queueing network: stations, memory pools with their queues
and prefix caches, the instance boundaries, and the flow between them
(deployment view). Here is examples/multi-turn/vllm.sq —
vLLM v1's engine:
Formats
--format tikz (default) writes a tikzpicture needing only
\usepackage{tikz}. It is the default because a figure in a LaTeX document is
best TikZ source the document can \input: an image inherits neither the
document's fonts nor its rules, and does not diff.
--format svg writes a standalone file. Colours are presentation
attributes with a prefers-color-scheme override rather than CSS custom
properties, because librsvg and cairosvg ignore var() and paint the
result black.
This part is a divergence from pyncd, not a copy of it
tsncd, the renderer behind pyncd, has no TikZ backend at all: it draws
SVG into the DOM with KaTeX and captures with html-to-image, and its
figures reach notebooks and pages as images. That is right for its target.
What is borrowed from tsncd is the layer that makes a second writer
cheap — one Figure, two writers, and geometry unit-tested instead of
bytes.
How it is put together
src/view/figure.rs     the geometry a view produces and a writer consumes
src/view/deployment.rs ir::Program -> Figure   the network projection
src/view/tikz.rs       Figure -> String
src/view/svg.rs        Figure -> String
Figure is the test surface; no writer decides a coordinate. tests/draw.rs
asserts on rectangles and on the projected network, with golden files guarding
the writers (make draw-golden). make check draws every program in both
formats, and every IR file in tools/oracle/.
What is not done
- A pool held in two places is drawn twice, as two frames or two enclosures. That is correct — a box spanning both would swallow the stations between them — but nothing beyond the name says the two are the same pool.
- One station row. A program with many stages runs off to the right instead of wrapping.
- Long expressions are elided with
~rather than wrapped or footnoted. letnames are gone.cap blocks * bsprints as160000— the IR folds constants, and the folded value is what the run uses.- No step-trace figure. The figure with iterations across and residents
down — where magnitude and the invariant
allocated + cached ≤ caplive — needs a structured trace that--dumpdoes not emit. It is the natural next one.